Iteration 2/3 Jack - Working with Pulse Sensor
This iteration involved working with the pulse sensor, testing it and getting pulse values out to be used for the hat. The intention is to use the pulse sensor to control an aspect of the hat, such as its sonification or lighting.
Equiptment used:
Microbit with DFRobot Breakout Board.
Pulse Sensor
Serial Port Plotter
Sensor Functionality:
The pulse sensor that was used works by shining a light through the skin, and using a photodetector to detect the reflected light. Interestingly enough this sensor doesn't actually detect the bloodflow itself directly, but rather the presence of oxygen in blood, which effects the amount of specific wavelengths of light used by the sensor that are reflected back. Pulse detection by this means is called a Photoplethysmogram.
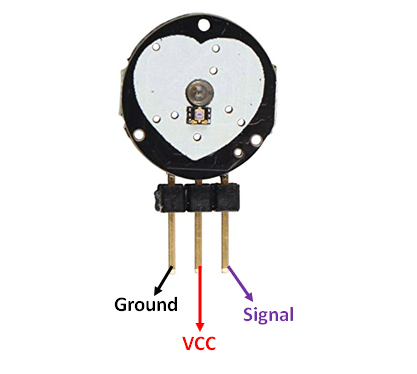
The sensor is pretty simple, it has 3 pins, 2 for power and ground, and 1 for signal.
One of the main difficulties of using this sensor is getting it working. It requires a lot of playing around with the areas it is used in and the pressure applied. The intent is to mount it to the ear lobe in at the final stage where you can pick up a small pulse and it is close to the hat but I found it easiest to conduct the testing on my finger.
The sensor is also very sensitive to light to to it using a photosensor, so changing the lighting around the sensor by for example readjusting the position of the sensor will throw off readings. This can be mitigated by making sure the sensor is properly secured to you and the sensor is hidden from direct lighting.

Using the Serial Port Plotter app greatly aided in the process. By adding a serial print to the microbit code for the values you can see what the sensor is picking up and adjust accordingly.
Code Functionality:
Originally determining if the output of the sensor was a pulse was done using a detection threshold, where a pulse would be counted once a value went above and below a certain threshold value.


After this, a system that detected the rate of change of the sensor output (the slope of the graph) was chosen afterwards. This worked by storing a previous value and checking it against the current value every few milliseconds. The discrepancy between these values lets us know if the graph is going up or down, and by how much in the given period.

By adjusting the system and adding flags to check if the system has changed its state from going up to down and the slope threshold we can make the sensor act and pick up a pulse in a consitent way no matter who is using it or where it is used. It could also pick up the second smaller pulse part of the beat which means extra data about the heart cadence.
Microbit Code: https://makecode.microbit.org/_UeMDzKbY8d4Y


Comments
Post a Comment